Public Open Data Portfolio Demo
Green CertificateShortfall Analytics
Azure Data Factory
Databricks
Power BI
AI + MCP
An end-to-end data platform concept for monitoring Australia's Renewable Energy Certificate (LGC / STC) shortfalls, built on real public register data from the Clean Energy Regulator.
Public-data demo: This independent learning project uses publicly available CER data only. It does not use or represent any employer's data, systems, confidential methods, or internal work.
1
Business Context
Business Problem
Liable entities under Australia's Renewable Energy Target scheme, electricity retailers and large energy users, must surrender enough Large-scale Generation Certificates (LGCs) and Small-scale Technology Certificates (STCs) each year to cover their obligations. When they fall short, a shortfall charge applies and the shortfall is recorded on the Clean Energy Regulator's public register. That register is published as a flat, biannual spreadsheet with no easy way to see who is falling short, how shortfalls trend over time, or which entities carry the largest outstanding balances, so regulators, analysts, and the liable entities themselves have no single place to monitor this compliance risk.
Learn More About REC Market →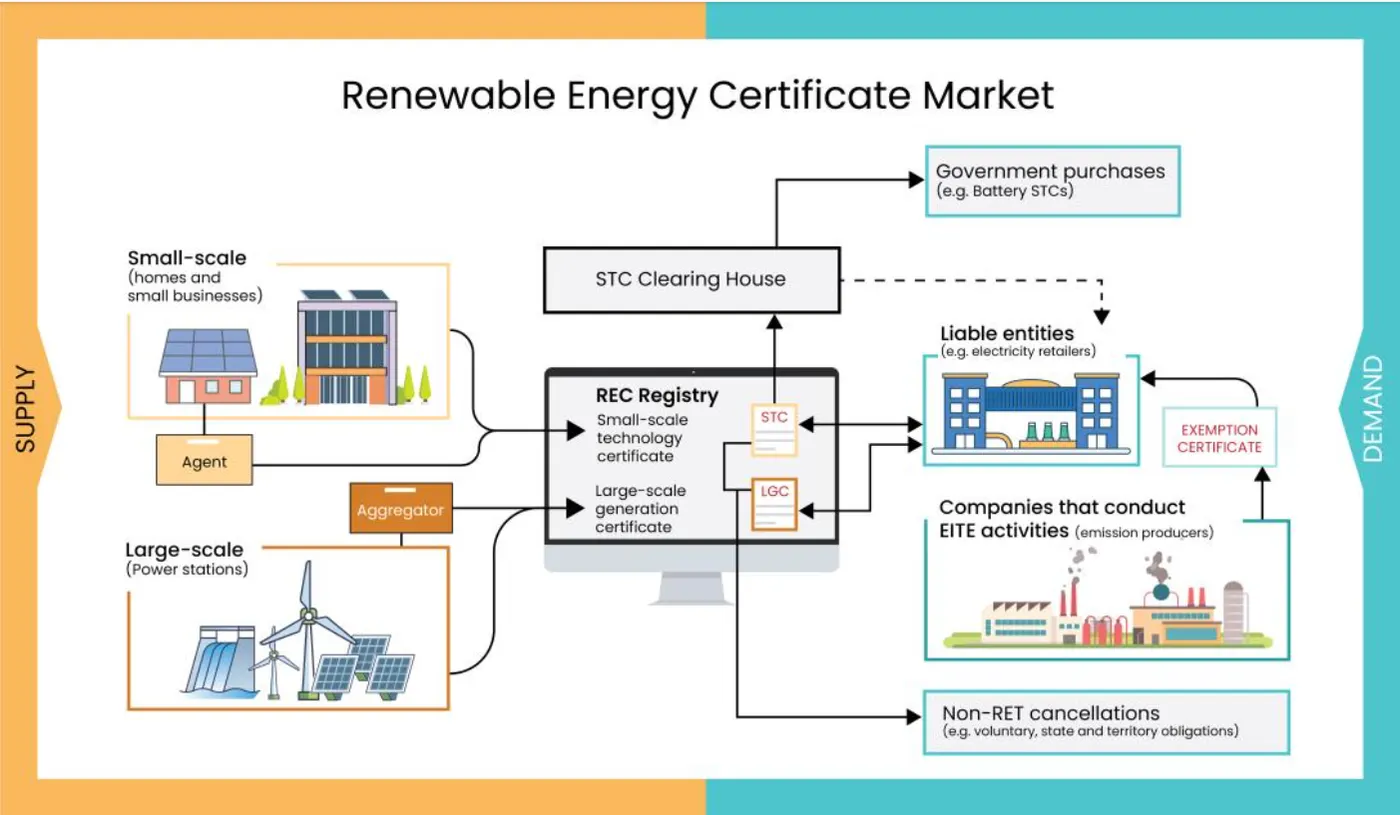
Project Scope
In scope
- Ingest and model the CER's published LGC and STC shortfall registers
- Compute entity-level and year-level shortfall trends from the real data
- Present the data as an interactive dashboard with drill-down to top offenders
- Provide a natural-language query interface over the dataset
Out of scope
- Real-time register updates, CER publishes twice yearly; this reflects a point-in-time snapshot (2026-07-03)
- Forecasting or predicting future shortfalls
- Certificate types outside LGC/STC (e.g. ACCUs)
Functional Requirements
- FR1 Ingest the published LGC and STC shortfall CSV registers
- FR2 Compute total and per-entity shortfall by assessment year
- FR3 Display year-over-year shortfall trends as charts
- FR4 Rank and display top liable entities by cumulative shortfall
- FR5 Let users ask natural-language questions and get an answer grounded in the data
- FR6 Visualize the underlying dimensional data model
Non-Functional Requirements
- NFR1 Core browsing works entirely client-side on static hosting, no backend required
- NFR2 Usable on both desktop and mobile viewports
- NFR3 AI Query degrades gracefully to a local rule-based fallback if no AI backend is configured, so it never appears broken
- NFR4 No secret credentials exposed in client-side code (AI backend key stays server-side)
- NFR5 Meets basic accessibility practice, sufficient color contrast, non-color-only indicators, dark/light mode support
2
Solutions Architecture
Conceptual pipeline for turning the CER's published registers into governed, queryable analytics, this project implements the source ingestion and dashboard layers below using the real register data; the orchestration/AI layers illustrate the intended target design.
Source Systems
- REC Registry
- Liable Entities
- Reference Data
- External Systems
Azure Data Factory
- Ingestion
- Orchestration
- Scheduling
- Monitoring
Databricks (Medallion)
Bronze
Silver
Gold
- Raw ingestion
- Cleansed & standardized
- Business model, aggregated
Power BI
- Semantic model
- Reports
- Dashboards
- Insights
AI Layer (MCP)
- MCP Server
- Query Bot
- Dashboard Assistant
- NLQ & Insights
↩ Metadata, Lineage, Monitoring & Security, spans every stage of the pipeline
3
Data Model
UML class diagram of the dimensional model, derived from the two source registers' actual published columns. Shared dimensions (liable_entity, assessment_year) link both fact classes.
Sources: LGC and STC certificate shortfall registers (CER). {PK} = dimension key, {FK} = foreign key into the dimension.
4
Dashboard
Live figures computed directly from the CER's published LGC and STC shortfall registers (downloaded 2026-07-03).
Liable Entities, LGC
69
Liable Entities, STC
55
Total Remaining Shortfall, LGC
10.25M
Total Shortfall, STC
293K
Remaining LGC Shortfall by Assessment Year
Certificates still outstanding, by the year they were assessed.
View data table
STC Shortfall by Assessment Year
Small-scale Technology Certificate shortfall since scheme start (2011).
View data table
Top Liable Entities, Cumulative LGC Shortfall
Top Liable Entities, Cumulative STC Shortfall
5
AI Query Assistant
Ask a question about the register data below, answered instantly by a rule-based engine running entirely in your browser against the real CER figures (no external AI call, so no API key or server involved).
YC
Which assessment year has the highest LGC shortfall?
AI
2023, with approximately 4.07M certificates in remaining LGC shortfall, the largest of any year on record.Source: Gold layer, fact_lgc_shortfall
Try one